
Was COVID-19 Just a Bad Flu Season?

Greetings friends!
This article is about how to think well about emotionally fraught topics. It is not about COVID-19, although we will answer the headline question.
If you have strong views about the question posed in the title, no matter what those views are, I encourage you to read on. Not to see if your belief is vindicated, but to learn something about how you think.
When our tempers rise (to say nothing of our temperatures), rational thinking is an early casualty. While we can learn to circumvent our emotional response, it only happens if we apply conscious effort.
Here’s a case study on how to do it, using what you’d think would be a pretty factual question: just how deadly was COVID-19?
To answer this question, we’ll follow a five-step process called DOCS-A. You might find it useful whenever critical thinking is called for.
D: DEFINE specific questions to be answered
Because we want to answer specific questions, not rehash our feelings about COVID-19, we start by clearly defining those questions:
- How many people died from COVID-19 in your country? Globally?
- What do you think about the reliability of data you might have seen? Were COVID-19 deaths accurately reported?
- And coming to our title question, how did COVID-19 mortality compare to deaths from the seasonal flu? Was it catastrophically bad for humanity or a statistical blip?
I’ll ask you to take note of your current beliefs. If you genuinely want to check your thinking, take a moment now to write down what you think.
If you don’t write your thoughts down, I guarantee you will believe at the end of this article that you understood the facts correctly all along. And you’ll miss a chance to improve your critical thinking.
O: OBTAIN reliable data because only this enables objectivity
Our first and serious problem: where to go for accurate information? The closer we can get to primary sources, the better.
In this case, primary sources for reported deaths are largely unavailable to the average citizen without a great deal of legwork. Doctors in their millions report deaths and their causes to intermediaries like hospitals in their thousands. Hospitals, in turn, report to regulators on a local, state, and national level.
Small countries like Switzerland have relatively close visibility over such matters. Large countries like China, India, and the United States, not so much. Nations report, with varying frequency and honesty, to supranational bodies like the World Health Organization and the United Nations.
The motivated researcher without specialized access must find trusted guides. This will often be the case.
Our World in Data — One such trusted guide
In my experience, Our World in Data is a wonderful port of call if you want to get a quick sense of what data exists on a topic.
A collaboration of the University of Oxford and the non-profit Global Change Data Lab, their goal is to make the world’s knowledge on big problems accessible and understandable.
They provide three key benefits: topical reports, organized by professional researchers; beautiful visualizations; and, critically, transparent access to source data.
For this article, we’ll consider data for the United States and the world as a whole. Here’s what we can glean from Our World in Data’s article on COVID-19 Deaths:
- Total confirmed COVID-19 deaths worldwide are just under 7 million
- Confirmed deaths in the United States are 1.1 million
We are helpfully given the link to the World Health Organization source for these figures, which itself provides extensive details on how it has aggregated the data.
C: CONSIDER reasons why our data sources might be fallible. Can we trust these numbers? Why or why not?
Here is a fundamental truth about how humans behave with numbers:
- When we find a figure that supports our belief, it is reliable.
- When someone quotes a figure that contradicts our belief, it must be faulty.
Knowing this tendency, can we fight it? Yes, but only if we are willing to have our beliefs proven wrong. Or, more generously, if we are willing to update our understanding based on new information.
Already here we encounter resistance from people who don’t like the data we’ve chosen. They will tell you the source data is unreliable. Unfortunately, they will have a point.
For example, when countries have a strong motive to lie about the data they report and no negative consequence for doing so, we can fully expect them to lie.
- Some countries likely under-reported deaths to support claims of superior pandemic handling (China, North Korea).
- Some countries may have over-reported deaths either to justify onerous lock-down measures to their fractious citizens or because hospitals were incentivized to claim deaths as COVID-19-related (the United States).
S: SEEK out ways to confirm or corroborate data
If you think your source data may have noise or be compromised, seek alternative data sources to double-check.
Let’s take the question of whether the U.S. over-reported deaths. Were hospitals paid for reporting deaths? This seems not to be the case. For details, see this AP fact check.
Looking behind the fact-checkers to the actual regulations from the Health Resources and Services Administration, we see health providers were paid for COVID treatment, not deaths, and only paid thusly for Medicare patients, which is a fraction of all patients.
Did some countries under-report? Without getting into specifics, it is to be expected for the reasons noted above.
We can still make progress by looking at other data, for example, reported total deaths. Doctors have flexibility about what cause of death to report on a certificate. But the fact of a person dying is much harder to argue about.
Thus, even though in the short term chicanery in reporting total deaths is still possible, over time we have a pretty good idea of how many people die each year.
A: ANALYZE the data objectively, with a commitment to go where the data leads
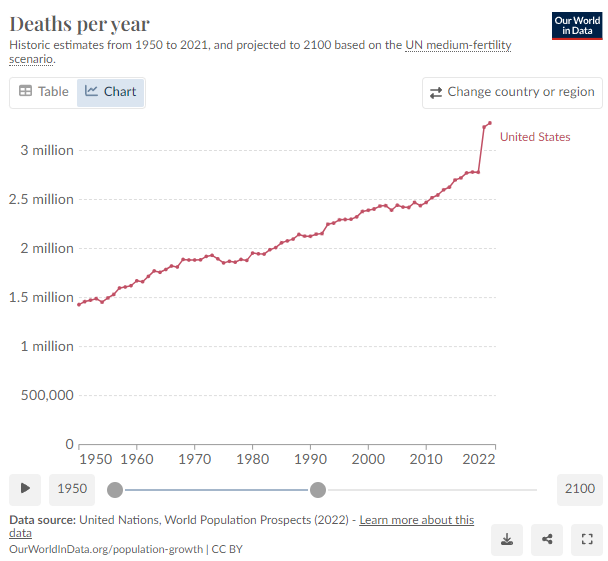
Our World in Data provides a helpful summary in this report How many people die … each year? This allows us to see how many more people died in 2020 and 2021 than before the pandemic.
Total deaths from COVID-19 will likely be some number less than the total excess deaths in those years, although there are no doubt confounding factors.
Here’s how it looks for the U.S., where we see some 500,000 excess deaths in each of 2021 and 2022, about 18% higher than the prior several years.
Excess deaths for the U.S. of about 1.1 million is quite close to the figure of COVID-19 deaths the U.S. reported. So we can assume this figure has some validity. I.e., if the U.S. exaggerated COVID-19 deaths, it was not by much.
Figures for the whole world similarly spiked, with a bit under 17 million excess deaths over the two years. The 2021 figure represents a 20% increase over the pre-pandemic period.
Why were global excess deaths so much higher than reported COVID-19 deaths? We can triangulate what happened by calling upon the UN Population Division’s report World Population Prospects 2022.
The UN tried to tease out how much of total excess mortality was due to COVID-19 and came up with a figure of 14.9 million over the two years, more than twice as high as the officially reported deaths. (See Summary of Results, p. 21.)
It seems many countries fell prey to the temptation to under-report the impact of COVID-19.
As a gut check, we note that the UN’s estimate of COVID-19 deaths represents about 90% of the total excess mortality across the world in the two years, which is plausible.
How do COVID-19 deaths compare to flu deaths?
We are a few steps nearer to being able to answer the question because we now have figures for total deaths and COVID-19 deaths.
To wrap up, we need to assess data about flu deaths. For this, we turn to our trusted guides at Our World in Data and, for U.S. source data, the CDC.
These sources tell us that historically an average of 400,000 people die each year from flu deaths globally, and 35,000 per year in the United States.
Gut check: the U.S. represents about 4.2% of the world’s population, but per these statistics, suffers more than 8% of estimated flu deaths. This suggests the global estimate is too low, the U.S. figure is too high, or likely both.
But let’s assume the figures are at least directionally roughly accurate.
What is clear is the historical average number of deaths from the flu is considerably lower than those from COVID-19. Indeed, COVID-19 was more than 10 times more deadly than a normal flu season.
How do COVID-19 deaths compare to all deaths?
Last but not least, although COVID-19 was considerably worse than a normal flu season, was it a global catastrophe? One way to examine this is to compare COVID-19 deaths to total deaths in an average year.
Here’s what Our World in Data tells us in their report What do people die from?
Of a total of a bit under 60 million deaths a year, respiratory diseases of all kinds account for 4 million in a normal year. The COVID-19 years saw this figure more than double (i.e. about 8 million a year). Not great, but also not a global catastrophe for humanity.
Executive summary for the dedicated scroller
Topics that arouse strong emotions challenge our critical thinking abilities. You will be wrong less often if you can leave your emotions aside and apply a systematic approach.
To avoid resorting to angry tribalism, you can apply the DOCS-A method:
- Define the question you are addressing, the more specifically the better.
- Obtain reliable data, using trusted guides to help you, referring to original source data whenever possible.
- Consider reasons why even the source data may be unreliable.
- Seek out (more) reliable data that might shed light on your question from another angle.
- Analyze your question objectively in light of the data you’ve obtained, with the commitment to go where the data leads.
It’s time-consuming to follow this method. But when the stakes are high, I trust you’ll agree it is worth it.
Be well.
Want an easy way to get access to both data and analysis from an eminently trustworthy source? Subscribe to all my stories and you’re on your way.
Member discussion